Customer Analytics: 6 Key Types Of Customer Analytics & How To Collect Data For Analyses?
How can you leverage customer analytics to drive product growth in your SaaS business?
Customers are one of your most valuable assets. It’s crucial to maintain track of customer needs and even exceed their expectations if you want to take a customer-centric approach to growth.
In this article, we’ll discuss the 6 different types of customer analytics and how you can collect data for each of them.
Let’s get started!
TL;DR
- Customer analytics is the systematic process of collecting customer data and analyzing them to make well-informed decisions.
- Analyzing customer data lets you understand user behavior, develop customer-focused marketing practices, and increase customer lifetime value.
- There are four categories of customer analytics: descriptive, diagnostic, prescriptive, and predictive.
- Journey analytics helps you measure the effectiveness of your strategies to improve touchpoints.
- Experience analytics identifies friction points so you can fix them to improve user experience.
- Engagement analytics provides insights into user interactions so you can find solutions to boost engagement.
- Behavior analytics helps you understand customer behavior across every touchpoint and channel.
- Retention analytics helps you understand how satisfied your customers are.
- Loyalty analytics show how likely your customers are to recommend your product to others.
- Userpilot, Mixpanel, and Hotjar are the best 3 customer analytics platforms.
What is customer analytics?
Customer analytics is the systematic process of collecting customer data and analyzing them to make well-informed decisions.
It gives you insights into users’ opinions, behavior and feedback so that you can better understand your users.
What is the importance of customer analytics?
Customer analytics helps you find, attract, and retain the most profitable customers, as well as find ways to remove the bottlenecks in the customer journey and optimize the customer experience.
Here’s how.
Collect customer data to make informed business decisions
Without data, you’re left with guesswork which has a 50%-50% chance of being either good or bad. And this is not the right approach if you want to keep your customers satisfied.
Analyzing real data allows you to align your strategies with valuable insights. You can develop customer-focused marketing practices that, in turn, help you boost customer engagement and retention.
Understand the logic behind customer behavior
Implementing customer analytics helps you observe and even predict trends in user behavior. You can also find out what features users engage with the most and what benefits they gain from your product by understanding user behavior patterns.
Behavioral segmentation lets you better understand the logic behind the actions of customers from different behavioral segments. Thus, you can personalize the onboarding process and in-app experiences.
Improve the product and increase the customer lifetime value
User analytics can offer insights into how customers interact with your product at each stage of the customer journey. Thus, you can identify existing and potential friction points in the journey that block users from going forward.
Fixing these bottlenecks will drive more value for your customers and improve retention. This, in turn, will increase your customer lifetime value (CLV). Higher CLV translates to greater revenue and product growth for your SaaS company.
Customer analytics categories
You can break down user analytics into 4 broad categories:
- Descriptive analytics
- Diagnostic analytics
- Predictive analytics
- Prescriptive analytics
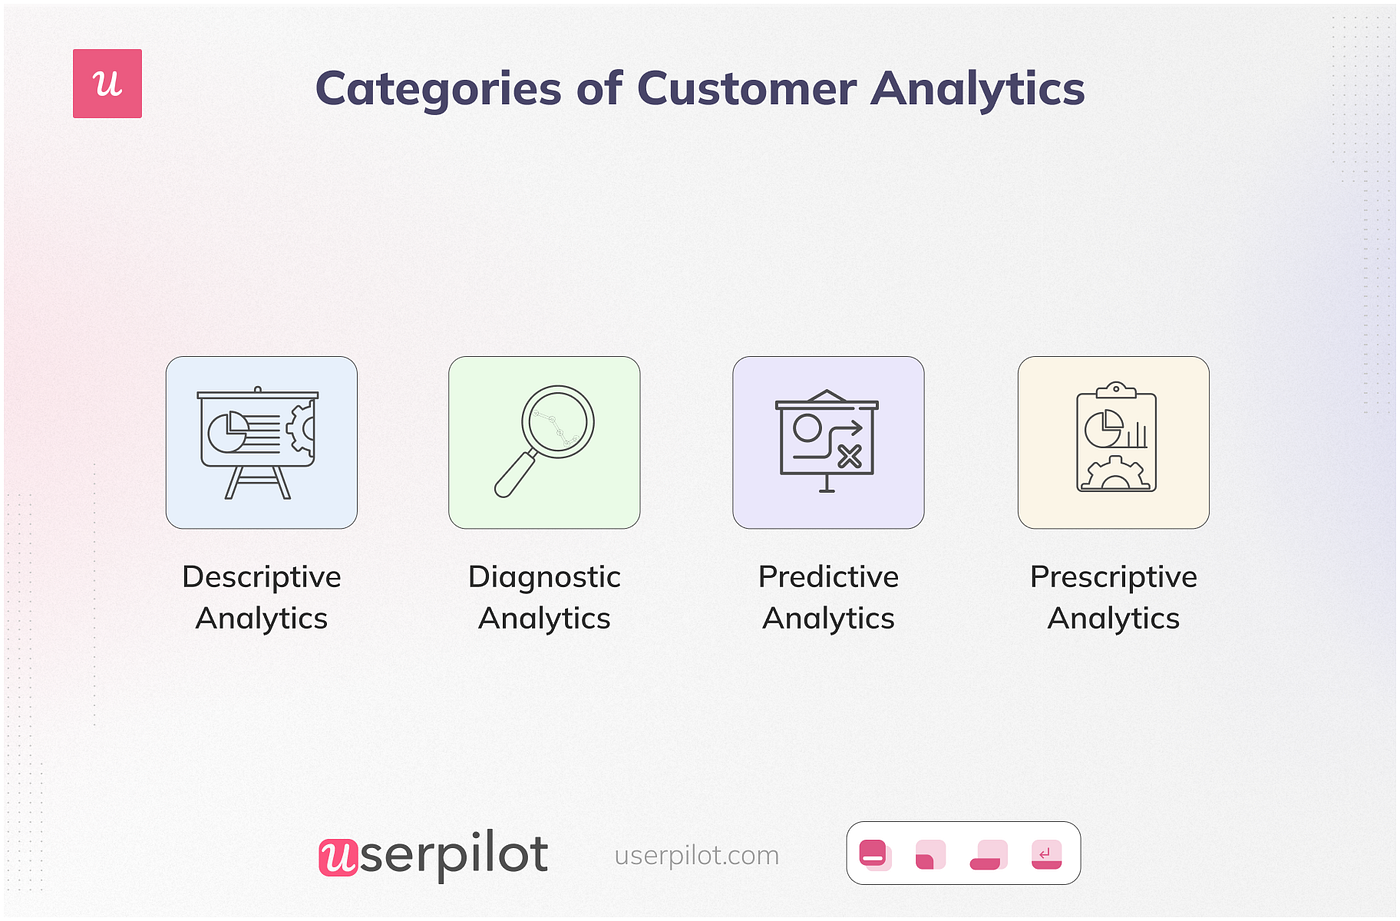
Now let’s see what they are all about.
Descriptive analytics
Descriptive analytics looks at past customer data to identify trends and patterns within specific user segments. Analyzing historical data gives you a clear view of your journey with customers. It helps you know what strategies worked and didn’t work for your customers.
For example, you might learn from descriptive analytics that 25% of your users churned after x interactions. If a quarter of your customers are leaving your product because of similar issues, then you should look into where things went wrong and improve your product accordingly.
Diagnostic analytics
Diagnostic analytics uses data mining and discovery techniques to determine the reasons behind user data trends. Resolving these root causes will help customers get more value from your product and show that you care about their needs.
For instance, you may notice that 50% of your users believe that a particular product is not what they expected it to be. Now you need to dig deeper to know whether that product exceeded their expectations or failed to provide value.
Predictive analytics
Predictive analytics deals with both current and historical data to find areas of improvement and find future possibilities for any event. It is the best for analyzing trends and patterns within customer segments.
Suppose that in Q1 of 2023, your product’s purchase rate is expected to decline. You can now collect user feedback to understand what customers want and take the necessary steps before your closed deals start to drop.
Prescriptive analytics
Prescriptive analytics is used to get recommendations on what you should or shouldn’t do in certain situations. It offers input into the most optimal action you can take in a specific situation.
For example, prescriptive analytics can reveal that online advertisements and social media marketing can boost your sales by 20%. You need to plan your marketing campaigns to fit this particular scenario.
6 types of customer analytics and how to implement them
Here are the 6 types of customer analytics you can perform.
- Customer journey analytics
- Customer experience analytics
- Engagement analytics
- Loyalty analytics
- Retention analytics
- Loyalty analytics
Customer journey analytics
This type of customer analytics deals with user interactions with your business at each touchpoint across several channels and over time. It helps you measure the effectiveness of your strategies to optimize touchpoints.
Before performing this analysis, you need to map out the user journey.
Customer journey mapping is a process where you map out and analyze the road a customer takes from signing up as an active customer to when they become a loyal, brand advocate. Thus, it covers all the interactions a user has with your product and brand.
After mapping out the user journey, you can determine the stages and touchpoints you need to analyze. For example, you can see how users engage with a particular feature during secondary onboarding and where they’re facing friction.
Here’s a sample of the customer journey that you may find useful.

How to collect data for customer journey analytics?
To collect data, first, you need to establish milestones in the journey. You can set them up as custom goals and track progress toward their completion.
Userpilot allows you to set up such milestones as custom goals and easily track customers’ progress toward them.
The image below shows some examples of custom goals and the percentage rate of completion for each of them. You can also get an overview of the most completed custom goals.

Customer experience analytics
Your user experience needs to be top-notch for customers to never consider switching to a competitor. This is because one bad experience may be enough to drive a user away from your business, especially if they haven’t reached the loyalty stage yet.
Customer experience analytics or CX analytics is the process of collecting all data on user engagement. The aim is to identify and remove friction points to reduce customer churn and lead to greater product growth.
You should also offer the best customer service by promptly attending to customer issues and notifying them of the issues being resolved. These are likely to improve both user retention and loyalty.
How to collect data for customer experience analytics?
This form of customer analytics involves collecting data from metrics like the customer satisfaction (CSAT) score, Net Promoter Score (NPS), Customer Effort Score (CES), and customer retention rate.
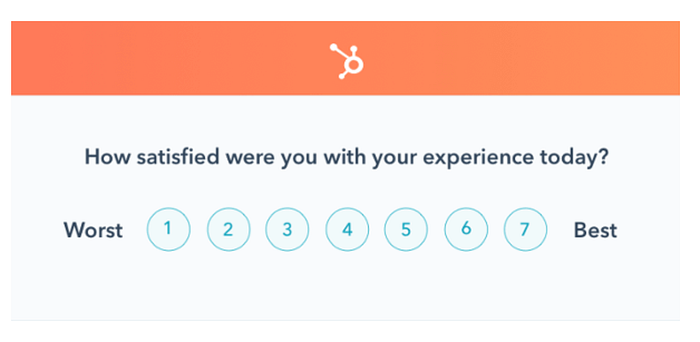
To analyze these metrics, you have to use microsurveys such as the CSAT, CES, or NPS surveys to collect user feedback. One of the most effective surveys for gaining insights into customer experience is the CSAT survey.
The CSAT survey not only collects feedback on your product and brand, but also on user experiences with features, customer service, tech support, and the like.
You can use this survey to analyze user experience across multiple touchpoints. Below is an example of a CSAT survey by HubSpot.
Customer engagement analytics
User engagement involves all user interactions with your brand across all the touchpoints throughout the customer lifecycle. Engagement can occur via multiple channels such as in-app customer experiences, emails, and live chat with the support team.
Customer engagement analytics involves using collected or available data for analysis and providing solutions to boost engagement. But now let’s see how to collect data for that.
How to collect data for customer engagement analytics?
One of the ways to measure engagement is the customer engagement score. The more satisfied your customers are, the greater the customer engagement score.
To measure this metric, you need to monitor engagement events like what core features customers engage with, upgrades and subscription renewals, or product usage frequency.
You can use feature tagging to monitor what users are doing inside your app. Userpilot enables you to tag any UI pattern and have it triggered every time a user clicks on it. You can even track hovers and text inputs. All of these without needing to code.
Customer behavior analytics
Customer behavior analytics helps you understand customer behavior across every touchpoint and channel. It uses both quantitative and qualitative data on user interactions.
Analyzing user behavior allows you to build more targeted and specific user experiences. This ensures that customers get relevant in-app content for their use cases.
Moreover, you can use behavioral analytics to find bottlenecks in the conversion funnel and remove them to improve conversion rates. You can also build reactive in-app experiences to improve engagement and feature adoption.
Last but not least, behavioral analytics can help you figure out where customers get stuck in the onboarding process and focus your attention on those areas.
How to collect data for customer behavior analytics?
You can use heat maps and session recordings to monitor user behavior and understand the reason behind their actions.
Heat maps help you monitor how customers interact with your product through visualizations. For example, you can visualize your conversion funnel to discover issues and solve them to increase conversion.
You can also use the data from heat maps and session recordings to segment users based on their shared behavior and other characteristics.
Analyzing session recordings can help improve onboarding. For instance, if a lot of customers from a particular segment are bouncing at a specific point in the onboarding flow, you can figure out the problem and reach out to your customers with the solution.
Customer retention analytics
Customer retention analytics involves analyzing user data to understand the factors that impact user retention and churn.
SaaS companies perform this analysis by looking at historical trends to predict retention rates among different customer segments. Thus, they usually have to track a particular segment within a set time frame. This helps you find the rates and reasons for churn among all user segments.
Customer retention analytics is of 2 types:
- Periodic analytics
- Retrospective analytics
Periodic retention analytics track particular user activity or events within a segment over a specific time period. Then, it measures the percentage of active users over each period by dividing the number of active users by the total number of customers in the segment.
On the other hand, retrospective retention analytics tracks when customers churn. It defines a period of inactivity that suggests churn. Then it calculates the percentage of users in a segment across longer intervals to find the churn rate.
How to collect data for customer retention analytics?
Collect customer data using a combination of methods, such as taking direct customer feedback using microsurveys and tracking their product usage.
Then, use behavior triggers to group customers.
Periodic analytics offers real-time insights into user activity while retrospective analytics give you the actual churn rates and areas of improvement.
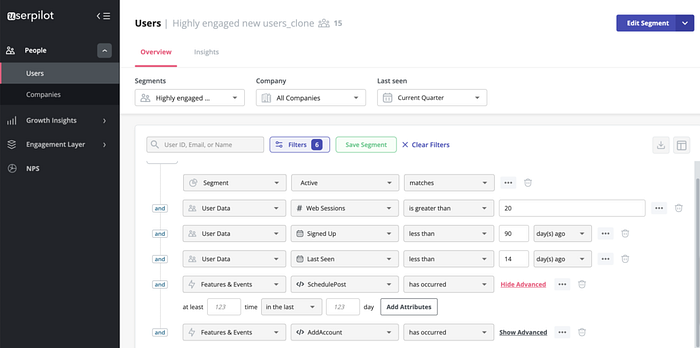
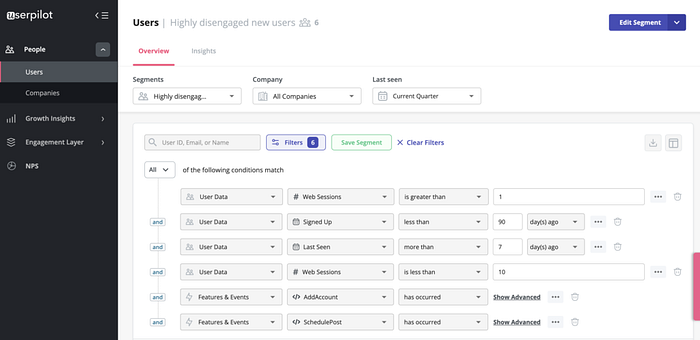
So you can collect retention data, segment customers based on their activity, and reach out to highly disengaged customers to see what the problem is.
Customer loyalty analytics
Customer loyalty analytics uses customer data from multiple sources to gain insights into user behavior and how loyal they are to your brand.
High customer loyalty can lead to greater retention. However, loyalty analytics is not the same as retention analytics.
Retention analytics helps you understand how satisfied your customers are. But not all of your retained customers will be loyal. Loyalty analytics show how likely your customers are to recommend your product to others.
It reveals patterns that help to enhance customer experiences. Thus, you can convert dissatisfied customers into happy ones who may even become loyal in the future.
How to collect data for customer loyalty analytics?
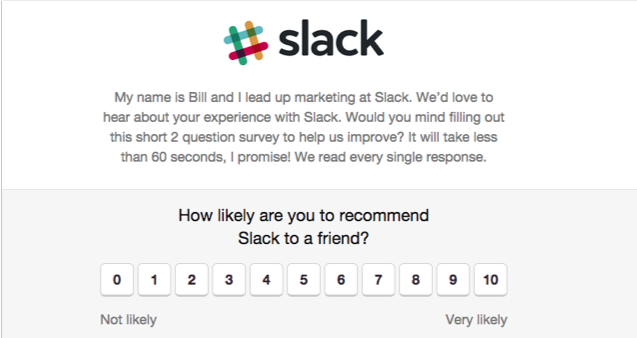
NPS surveys are the most effective for collecting data on customer loyalty. They ask customers how likely they are to recommend your product to others on a scale from 1 to 10.
This gives you 3 segments of customers:
- Promoters: who rate you 9 or 10.
- Passives: who rate you 7 or 8.
- Detractors: who rate or 6 or less.
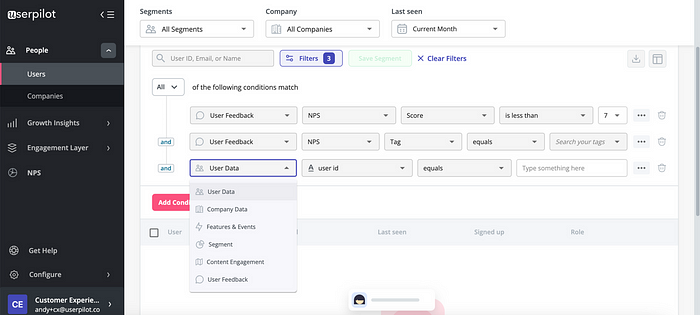
You should add a qualitative follow-up question to know the reasons behind each score. Also make use of NPS response tagging as it allows you to tag each response and group them into categories, such as “ease of navigation” or “missing features”.
Analyzing NPS feedback will help you understand what drives customer satisfaction and what disengages customers from your product. You can achieve all these with Userpilot, code-free.
Best customer analytics tools to conduct a customer data analysis
Let’s check the top 3 customer analytics tools out there.
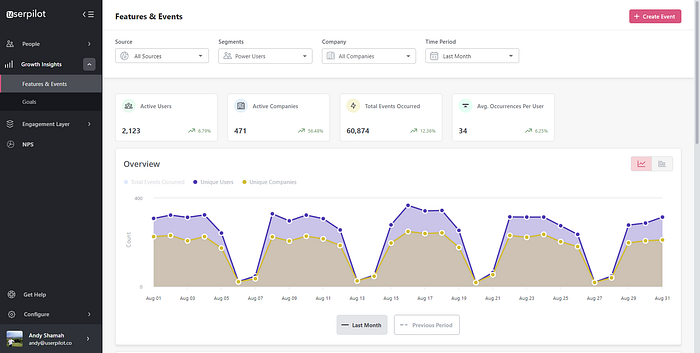
Userpilot — for collecting product usage data and customer feedback
Userpilot is a product growth platform that lets you build in-app experiences and personalize them for particular use cases:
- Create a welcome screen to collect information about customers and understand their jobs-to-be-done better.
- Track in-app user behavior and feature usage to identify your most active and engaged customers.
- Create different user segments, such as inactive users and power users to create personalized flows for them.
As mentioned earlier, you can also create NPS surveys with follow-up questions to measure and improve loyalty. You can also build other in-app microsurveys like CSAT and CES surveys and use the insights to improve customer experience and satisfaction.
None of these need any code, and the insights come organized in a nice analytics dashboard.
Userpilot offers a 14-day free trial, with the price of the “Traction” plan starting at $249/month, billed annually. The “Growth” and “Enterprise” plans charge $499/month and $1,000/month paid annually.
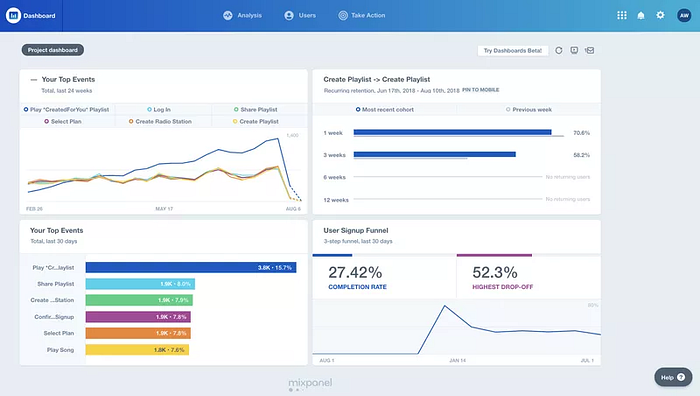
Mixpanel — for product analytics and data visualization
Mixapanel is a powerful platform for behavioral analytics. It allows you to track how every customer segment engages with your product and identify opportunities for customer success.
The platform’s data science models can predict user activity accurately and help you reduce churn proactively.
You do need some coding knowledge to use its A/B testing features, but the in-depth analytics is worth the effort.
Mixpanel’s free version offers limited features, and its paid plans’ pricing starts at $25/month.
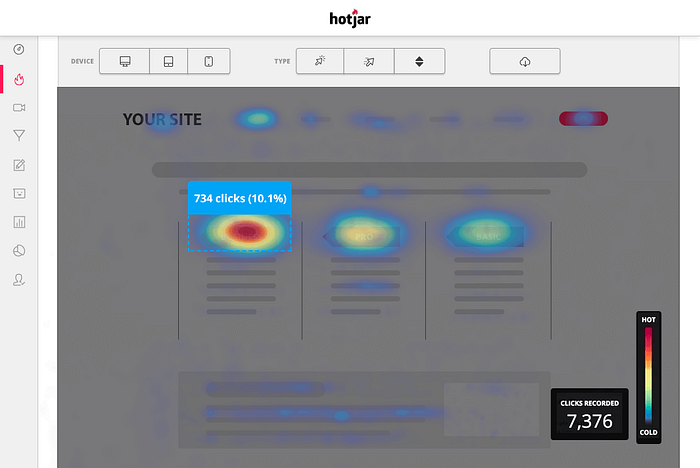
Hotjar — for having a deep understanding of customer behavior
Hotjar is a behavioral analytics platform best known for its heat maps feature. The heat maps track user interactions including clicks, scrolls, and movements.
It provides multiple other tools for data collection like session recordings and analytics that visualize conversion funnels and the entire customer journey.
Hotjar offers 3 subscription plans: Personal, Business, and Agency. The basic free version falls under the ‘Personal’ plan, and the paid version starts at $39/month. The ‘Business’ plan offers a 15-day free trial. Its paid version starts at $99/month for 500 daily sessions.
Wrapping it up
Customer data analytics helps you collect invaluable insights and improve various aspects of your business like customer experience, engagement, acquisition, retention, and loyalty.
You can collect data from multiple sources such as tracking in-app product usage, using microsurveys to collect direct feedback, and using heat maps to visualize user interactions, etc.
Want to track in-app user interactions and create microsurveys code-free? Get a Userpilot demo to get started!
