How to Analyse Qualitative Data: Methods, Steps, and Process
Wondering how to analyse qualitative data and get actionable insights? Search no further!
This article will help you analyse qualitative data and fuel your product growth. We’ll walk you through the following steps:
- 5 qualitative data analysis methods
- 5 steps to analysing qualitative data
- How to act on research findings
Let’s get started!
TL;DR
- Qualitative data analysis is the process of turning qualitative data into insights. This could be anything from customer feedback, surveys, website recordings, or in-depth interviews.
- Qualitative data is often seen as more “rich” and “human” than quantitative data, which is why product teams use it to refine customer acquisition and retention strategies and uncover product growth opportunities.
- As opposed to qualitative data, quantitative data analysis is the process of analysing numerical data to locate patterns and trends.
- Content analysis is a method of qualitative data analysis that involves systematically analysing a text to identify certain features or patterns.
- Thematic analysis is used to identify patterns and themes in data.
- Narrative analysis involves identifying, analysing, and interpreting the stories that customers or research participants tell.
- A grounded theory analysis involves the constant comparative method, which means that qualitative researchers analyse and code the data on the fly.
- Discourse analysis is about understanding how people communicate with each other. It’s used to analyse written or spoken language.
Here are 5 steps to analysing qualitative data:
1. Define your research questions to guide the analysis.
2. Collect qualitative data from user feedback, NPS follow-up questions, interviews, and open-ended questions.
3. Organize and categorize qualitative data to detect patterns and group them more easily.
4. Identify common themes, patterns, and relationships.
5. Summarize the qualitative analysis process.
- Userpilot will help you collect data with in-app microsurveys. It also offers a range of features to help you analyse that data, including sentiment analysis, and user segmentation.
What is qualitative data analysis?
Qualitative data analysis is the process of turning qualitative data — information that can’t be measured numerically — into insights.
This could be anything from customer feedback, surveys, website recordings, or in-depth interviews.
Qualitative data is often seen as more “rich” and “human” than quantitative data, which is why product teams use it to refine customer acquisition and retention strategies and uncover product growth opportunities.
Quantitative data analysis vs. Qualitative data analysis
Here let’s understand the difference between qualitative and quantitative data analysis.
Quantitative data analysis is the process of analysing numerical data in order to locate patterns and trends. Quantitative research deals with numbers and statistics to systematically measure variables and test hypotheses.
Qualitative data analysis, on the other hand, is the process of analysing non-numerical, textual data to derive actionable insights from it. This data type is often more “open-ended” and can be harder to draw conclusions from.
However, qualitative data can provide insights that quantitative data cannot. For example, qualitative data can help you understand how customers feel about your product, their unmet needs, and what motivates them.
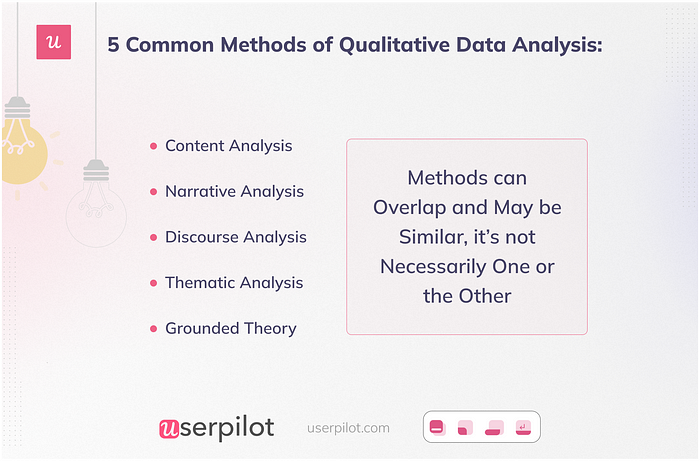
What are the 5 qualitative data analysis methods?
There are 5 main methods of qualitative data analysis. Which one you choose will depend on the type of data you collect, your preferences, and your research goals.
Content analysis method
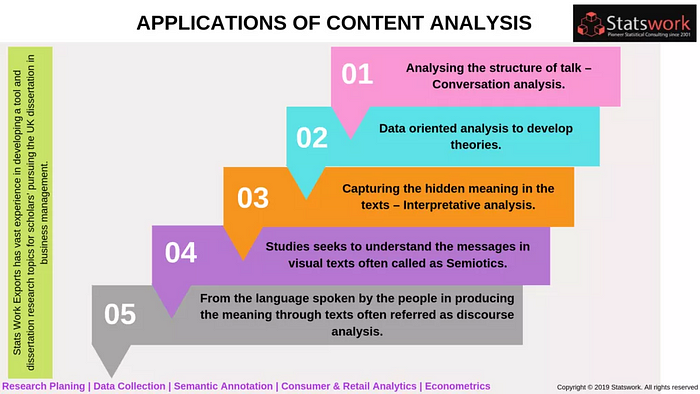
Content analysis is a qualitative data analysis method that systematically analyses a text to identify specific features or patterns. This could be anything from a customer interview transcript to survey responses, social media posts, or customer success calls.
The data is first coded, which means assigning it labels or categories.
For example, if you were looking at customer feedback, you might code all mentions of “price” as “P,” all mentions of “quality” as “Q,” and so on. Once manual coding is done, start looking for patterns and trends in the codes.
Content analysis is a prevalent qualitative data analysis method, as it is relatively quick and easy to do and can be done by anyone with a good understanding of the data.
The advantages of content analysis
- Rich insights: Content analysis can provide rich, in-depth insights into how customers feel about your product, what their unmet needs are, and their motives.
- Easily replicable: Once you have developed a coding system, content analysis is relatively quick and easy because it’s a systematic process.
- Affordable: Content analysis requires very little investment since all you need is a good understanding of the data, and it doesn’t require any special software.
However, content analysis has its drawbacks too:
- Time-consuming: Coding the data is time-consuming, particularly if you have a large amount of data to analyse.
- Ignores context: Content analysis can ignore the context in which the data was collected which may lead to misinterpretations.
- Reductive approach: Some people argue that content analysis is a reductive approach to qualitative data because it involves breaking the data down into smaller pieces.
Thematic analysis method
Thematic analysis is a popular qualitative data analysis method that identifies patterns and themes in data. The process of thematic analysis involves coding the data, which means assigning it labels or categories.
It can be paired with sentiment analysis to determine whether a piece of writing is positive, negative, or neutral. This can be done using a lexicon (i.e., a list of words and their associated sentiment scores).
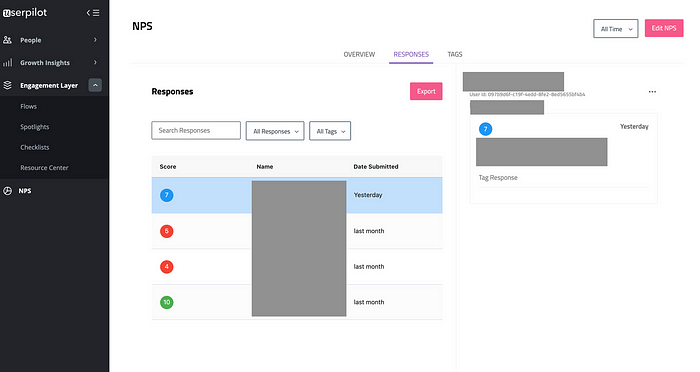
A common use case for thematic analysis in SaaS companies is customer feedback analysis with NPS surveys and NPS tagging to identify patterns among your customer base.
The advantages of thematic analysis:
- Doesn’t require training: Anyone with little training on how to label the data can perform thematic analysis.
- It’s easy to draw important information from raw data: Surveys or customer interviews can be easily converted into insights and quantitative data with the help of labeling.
- An effective way to process large amounts of data if done automatically: you will need AI tools for this.
The drawbacks of thematic analysis:
- Doesn’t capture complex narratives: If the data isn’t coded correctly, it can be difficult to identify themes since it’s a phrase-based method.
- Difficult to implement from scratch because a perfect approach must be able to merge and organize themes in a meaningful way, producing a set of themes that are not too generic and not too large.
Narrative analysis method
Analysing qualitative data with narrative analysis involves identifying, analysing, and interpreting customer or research participants’ stories. The input can be in the form of customer interviews, testimonials, or other text data.
Narrative analysis helps product managers to understand customers’ feelings toward the product and identify trends in customer behavior and personalize their in-app experiences.
The advantages of narrative analysis:
- Provide a rich form of data: The stories people tell give a deep understanding of customers’ needs and pain points.
- Collects unique, in-depth data based on customer interviews or testimonials.
The drawbacks of narrative analysis:
- Hard to implement in studies of large numbers.
- Time-consuming: Transcribing customer interviews or testimonials is labor-intensive.
- Hard to reproduce since it relies on customer stories, which are unique.
Grounded theory analysis method
Grounded theory analysis is a method that involves the constant comparative method, meaning qualitative researchers analyse and code the data on the fly.
The grounded theory approach is useful for product managers who want to understand how customers interact with their products. It can also be used to generate hypotheses about how customers will behave in the future.
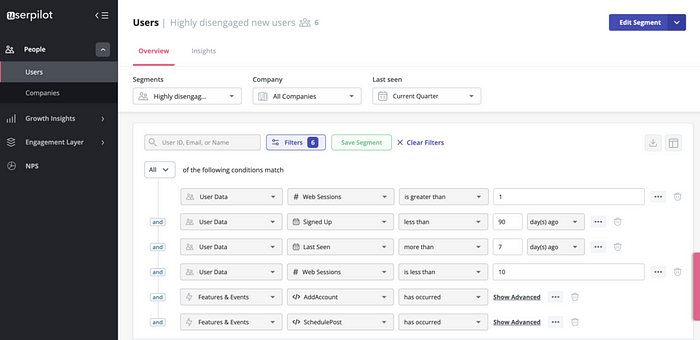
Suppose product teams want to understand the reasons behind the high churn rate, they can use customer surveys and grounded theory to analyse responses and develop hypotheses about why users churn and how to reengage inactive ones.
You can filter the disengaged/inactive user segment to make analysis easier.
The advantages of grounded theory:
- Based on actual data, qualitative analysis is more accurate than other methods that rely on assumptions.
- Analyse poorly researched topics by generating hypotheses.
- Reduces the bias in interpreting qualitative data as it’s analysed and coded as it’s collected.
The drawbacks of grounded theory:
- Overly theoretical
- Requires a lot of objectivity, creativity, and critical thinking
Discourse analysis method
Discourse analysis is about understanding how people communicate with each other. It can be used to analyse written or spoken language. For instance, product teams can use discourse analysis to understand how customers talk about their products on the web.
The advantages of discourse analysis:
- Uncovers motivation behind customers’ words
- Gives insights into customer data
The drawbacks of discourse analysis:
- Takes a large amount of time and effort as the process is highly specialized and requires training and practice. There’s no “right” way to do it
- Focuses solely on language
5 steps to analysing qualitative data
With all that theory above, we’ve decided to elicit the essential steps of qualitative research methods and designed a super simple guide for gathering qualitative data.
Let’s dive in!
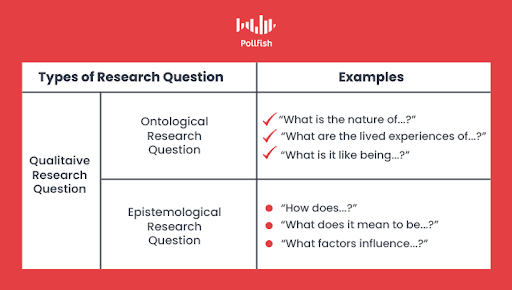
Step 1: Define your research questions
The first step in qualitative data analysis is to define your research questions. It’s important to be as specific as possible, as this will guide the rest of your analysis.
Examples are:
- What are the primary reasons customers are dissatisfied with our product?
- How does X group of users feel about our new feature?
- What are our customers’ needs, and how do they vary by segment?
- How do our products fit into our customers’ lives?
- What factors influence the low feature usage rate of the new feature?
Step 2: Data collection
Now, you decide what type of data collection to use based on previously defined goals. Here are 5 methods to collect qualitative data for product companies:
- User feedback
- NPS follow-up questions
- Open-ended questions in surveys
- User interviews
- Focus groups
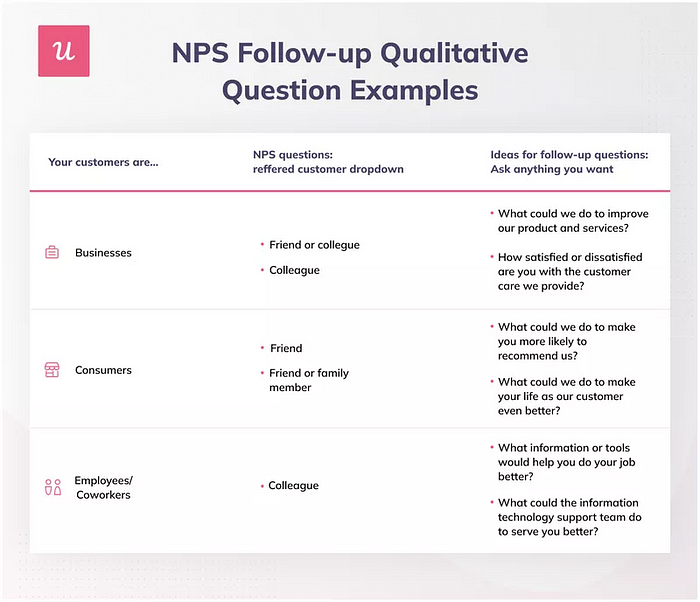
We recommend using a mix of in-app surveys and in-person interviews. The former helps to collect rich data automatically and on an ongoing basis. You can collect user feedback through in-product surveys, NPS platforms, or use Zoom for live interviews.
The latter enables you to understand the customer experience in the business context as you can ask clarifying questions during the interviews.
Step 3: Organize and categorize qualitative data
Before analysing customer feedback and assigning any value, data needs to be organized in a single place. This will help you detect patterns and similar themes more easily.
One way to do this is to create a spreadsheet with all the data organized by research questions. Then, arrange the data by theme or category within each research question.
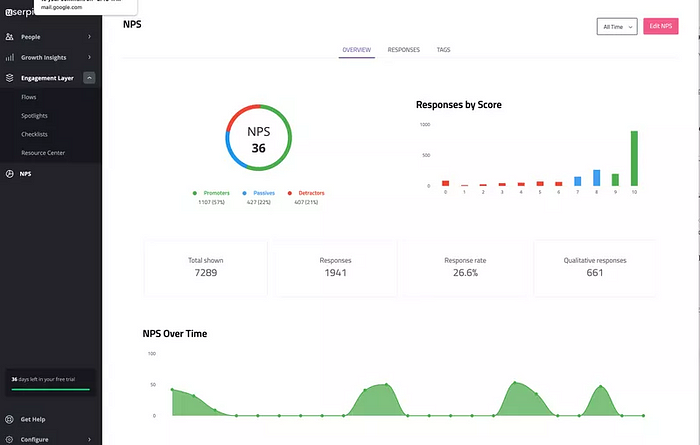
You can also organize NPS responses with Userpilot. This will allow you to quickly calculate scores and see how many promoters, passives, and detractors there are for each research question.
Step 4: Identify themes, patterns, and relationships
Themes are the building blocks of analysis and help you understand how your data fits together.
For product teams, an NPS survey might reveal the following themes: product defect, pricing, and customer service. Thus, the main themes in SaaS will be around identifying friction points, usability issues, UI issues, UX issues, missing features, etc.
You need to define specific themes and then identify how often they occur. In turn, the pattern is a relationship between 2 or multiple elements (e.g. users who have specific JTBD complain of a specific missing feature).
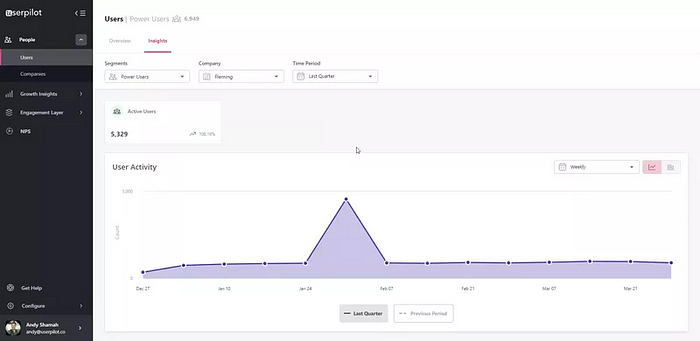
Pair themes with in-app customer behavior and product usage data to understand whether different user segments fall under specific feedback themes.
To track user behavior, use Userpilot’s features like Goals, Feature tagging (these monitor product usage), and advanced analytics to divide users by shared characteristics.
Following this step, you will get enough data to improve customer loyalty.
Step 5: Summarize the qualitative analysis process
The last step in qualitative research is to analyse the data collected to find insights. Segment your users based on in-app behavior, user type, company size, or job to be done to draw meaningful decisions.
For instance, you may notice that negative feedback stems from the customer segment that recently engaged with XYZ features. Just like that, you can pinpoint friction points and the strongest sides of your product to capitalize on.
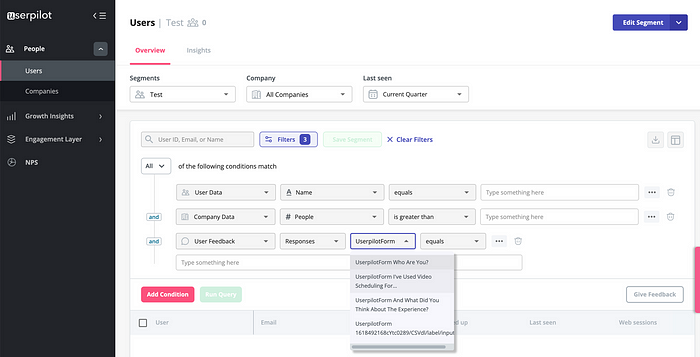
Analysing qualitative data with Userpilot
Userpilot is a product growth platform that helps product managers collect and analyse qualitative data. It offers a suite of features to make it easy to understand how users interact with your product, their needs, and how you can improve user experience.
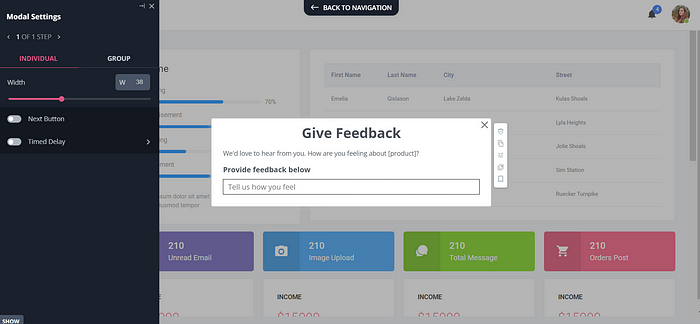
For qualitative research, Userpilot will help you collect data with in-app microsurveys and the NPS tagging feature.
It also offers a range of features to help you analyse that data, including sentiment analysis, journey mapping, and user segmentation.
You can run contextual microsurveys that are tied back to specific user actions. This helps to collect highly relevant feedback without impeding the customer experience.
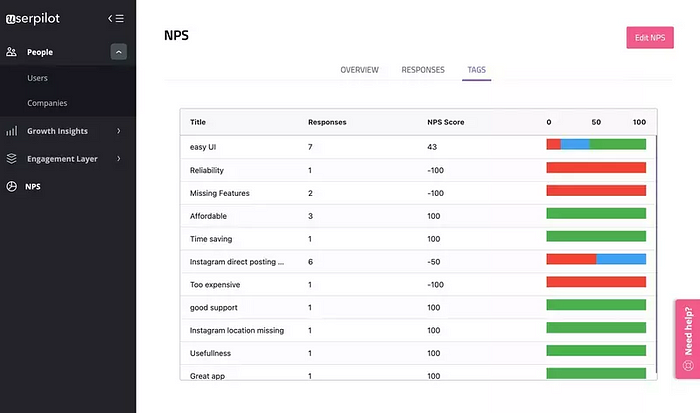
Once you have collected NPS responses, you can tag them to find reasons why users are happy/unhappy about the product (aka conduct the coding process). The example below shows that users lack the needed features and complain about the price.
With this tool in your arsenal, you’ll be able to make informed decisions about how to improve your product and grow your business.
Conclusion
The qualitative data analysis process is iterative and should be revisited as new data is collected. The goal is to constantly refine your understanding of your customer base and how they interact with your product.
Want to get started with qualitative analysis? Get a Userpilot Demo and automate the data collection process. Save time on mundane work and understand your customer better!
